The figures in Multiple Imputation in Practice are reproduced below. You can jump to each chapter or figure using the links in the list. They are also available in PDF format.
| Chapter 1 | Chapter 2 | Chapter 3 | Chapter 7 | Chapter 8 |
Chapter 1
Figure 1.1: Illustrations of patterns of missing data
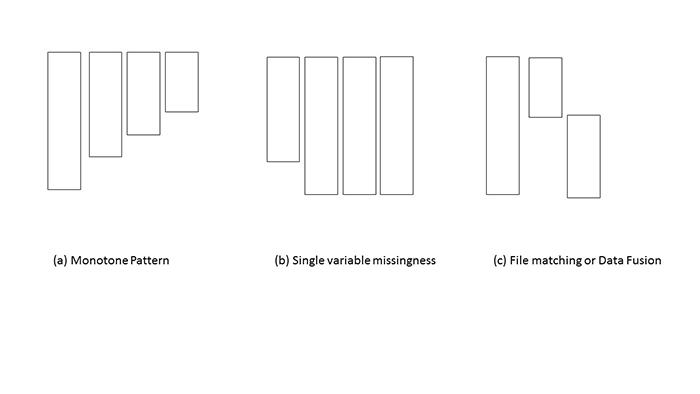
Figure 1.2: Scatter plots for the three-variable example
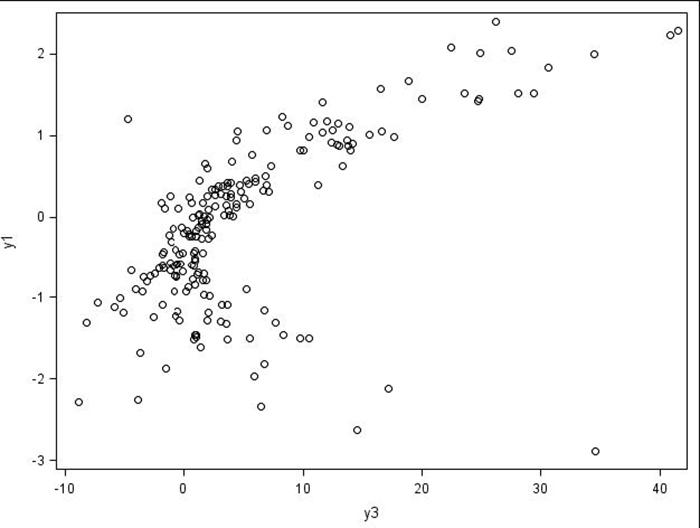


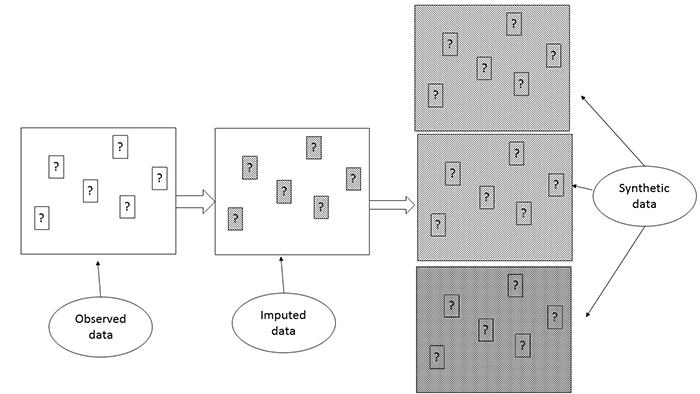
Figure 1.3: A schematic display of synthetic data sets produced by SYNTHESIZE module in IVEware.
Chapter 2
Figure 2.1: Diagnostics plots to compare the observed and imputed values of systolic blood pressure

Chapter 3
Figure 3.1: Regression diagnostics plots

Chapter 7
Figure 7.1: Schematics used in specifying structural equation models

Figure 7.2: An example of a structural equation model specification
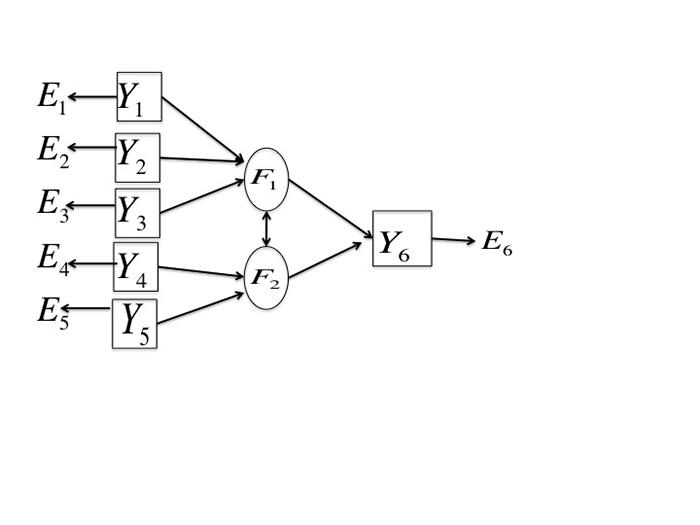
Figure 7.3: Schematic for structural equation model using National Merit Twin Study data
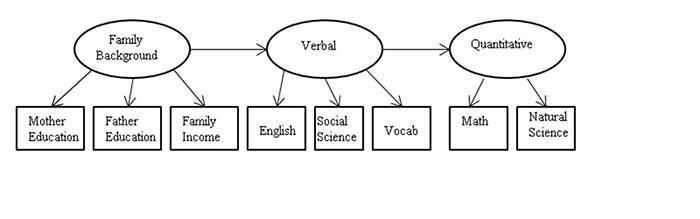
Figure for SEM Exercise 7.1: Path Diagram

Chapter 8
Figure 8.1: Estimated daily mean difference between Bup-NX and clonidine groups
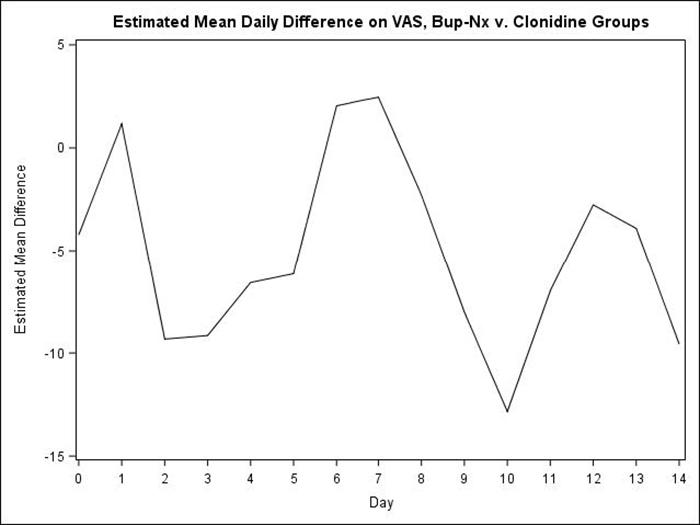
Figure 8.2: Head Wages/Salary (1998) by Observed v. Imputed
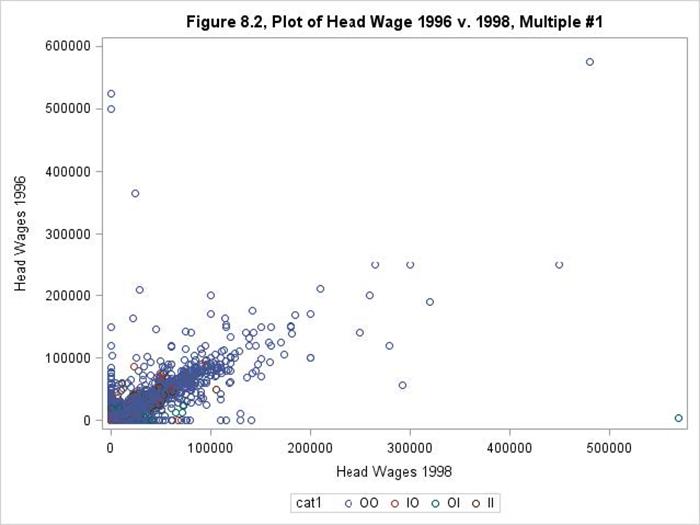
Figure 8.3: HeadWages/Salary(1996) v. HeadWages/Salary(1998), Observed v.Imputed

Figure 8.4: Head's Wages/Salary by Year and Sample

Figure 8.5: Individual Trends of Head Wages/Salary by Year

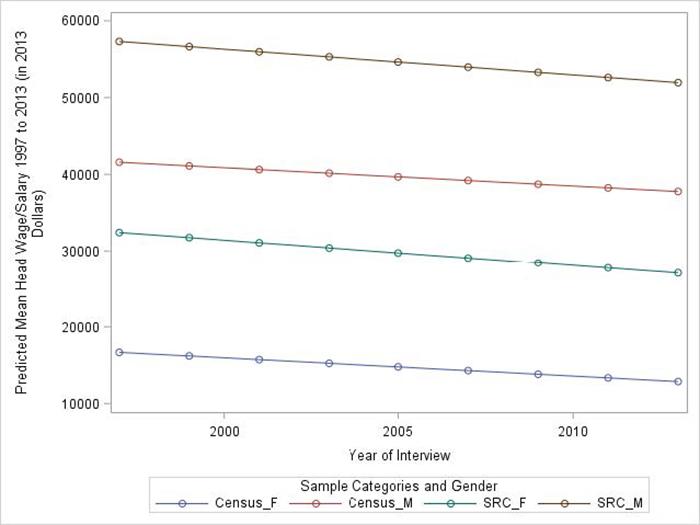
Figure 8.6: Predicted Wages/Salary by Sample, among all ages

Figure 8.7: Predicted Wages/Salary by Sample and Gender, among those age 30-65